
|
THE LIBERTARIAN ENTERPRISE Number 575, June 20, 2010 "The Internet is the collective consciousness of the human race" Special to The Libertarian Enterprise The term "balance day" refers to a day of market action that results in prices exiting at the end of trading about where they entered. That is somewhat off the mark, since the USA markets have overnight trading in futures, in clearing activity, and in overseas trading. So the morning open may be very distinct from the previous evening's close. Given these effects, what the financial media report about the market indicates a rise or fall against the previous evening's closing price. In the USA on 16 June 2010 the markets were up 4.69 points for the Dow to 10,409.46 or up 0.05%. Down 0.62 points for the S&P 500 to 1,114.61 or down 0.06%. Up 0.05 for the NASDAQ composite to 2,305.93 or up effectively 0.00%. Because of overnight trading creating a nearly continuous open (with periods for clearing) the term "balance day" is out of favour. Two things were significant about this balance day, I believe. One was that the trend from the day before was fiercely higher. That trend was broken by a day of trading which was not meaningfully higher. This appears to be a "failed trend" day. This trend up appears to have started 7 June and looked to be ended on 16 June. Another significant fact about balance days is that they often indicate a dramatic price change. Which way? We don't know. The previous trend could re-assert itself and send stocks much higher. The previous trend could be demolished by a dramatic surge down. Or the existing trend could assert itself more mildly. Of course, the way to bet in the current market is typically to guess that the market is going to go further down. More stupidity in government is likely to change the business environment in negative ways. More sovereign debt problems in Europe, Japan, and the USA are going to change things in negative ways. An ageing population reaching retirement in greater numbers is going to change the economy in many ways. Incompetent management coddled by enormous financial bail-outs and unprecedented privileges are going to continue to fuck up in monstrous ways, to make BP look typical. Did you hear that Fannie Mae and Freddie Mac have become penny stocks for more than 30 days, so they have been removed from trading from the New York Stock Exchange? I think Citigroup missed this de-listing in Spring 2009 by some intervention in the market. But the largest mortgage concerns in the country are no longer listed on the NYSE— they no longer qualify to be listed. Wow. Yes, a balance day is a technical or charting "signal." And I don't place any faith in the shadow puppets formed by market charts. But I am aware that others do, and that the market is significantly psychological, in some ways like a poker game. A little while ago I wrote about "Anticipating Market Behaviour." It occurs to me to mention that if you are looking for ways to test my expectation that the right shoulder of a fifteen year pattern was forming you could look for trades above 11,500 or below 7,500 on the Dow. Such trades would invalidate the formation if they occur before 2013. During 2013 or 2014 depending on the exact shape of the right shoulder, one would expect the formation to "complete" with a dramatic drop below 8,000. If this formation is completing as indicated, you may be able to make money with short term investments in exchange traded funds that mirror the market basket of the Dow. Such high volatility trading is risky, and should only be undertaken with funds you have available to lose entirely. Plus, remember, I don't believe any of this charting stuff, I am not offering advice (because I don't know your particular situation, at all), and my advice would be worth what you've paid for it (zero) or quite a bit less. Also note that the NASDAQ composite chart shows no such head and shoulders formation. Rather, it shows a very strong single peak in 2000 followed by a damping function. Are you familiar with a damping function? Have you ever used the "sustain" pedal or damper pedal on a piano? The function looks just like the price of gold from 1979 to 1999. A huge spike followed by a series of lower rises generally falling off until a more or less flat level is obtained. NASDAQ is showing this exact pattern. Charting technicians call it a "pennant" formation. The S&P 500 shows a convincing double top at about 1,500. It may form a third top roughly the same level, or it may trade substantially below 1,500 for many years. The Wilshire 5000 shows a head and shoulders formation similar in shape and duration to the formation on the Dow. The NYSE composite shows the same head and shoulders type formation. One of the truisms that my debate coach, Carl Mibeck, used to utter, was "If it has happened, it is possible." So, I would like you to take a look at a 25 year chart of the Nikkei 225. It shows a very similar head and shoulders formation between 1987 and 1992 with a peak near 39,000 at the very end of 1989. The formation shows a "neck line" at about 25,000. Since then the Nikkei has never reached that level. 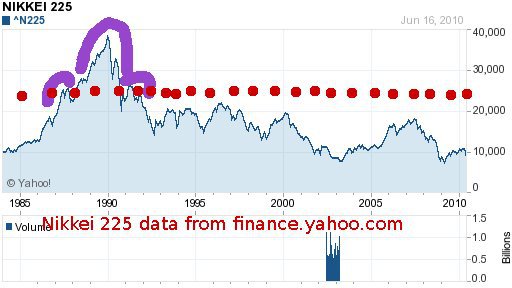 Does the similarity between the Nikkei in 1989 and the Dow in 2007 mean anything? Probably not. But it is a fascinating look at charting and market psychology. Can the Nikkei ever break out above 39,000? Of course. But to do so there would have to be fundamental changes in the business environment in Japan. A much smaller government, a much younger population, a much larger export market, a corporate philosophy that didn't tolerate the repeated failures exemplified by the recent series of recalls by Toyota, a much lower national debt, and free market money would individually be fundamental changes to the better. Combined, three or four of these changes would be monumental in their effects—and that would also be true of the USA economy. (Of course, the espionage-military-industrial-financial complex couldn't tolerate such changes, any more than they can tolerate the possibility of Okinawa no longer hosting American air bases.) There are of course dozens of composite indices, including indexes in foreign countries. So, check the charts, look for the formations, don't misunderstand what to expect. And don't be surprised if what happens is vastly different from what I've suggested might happen. Your mileage will vary. By the way, it appears that the thing I least expected (but did mention) is what happened. The end of trend signal on the 16th on the Dow was not confirmed, and the trend extended itself a tiny bit on Thursday, and again a tiny bit on Friday. Whether the major market interventions by the Plunge Protection Team were involved, we won't know for a while. However, on broader markets, there was a very tiny change, again, Thursday. NASDAQ was up 1.23 points for a 0.05% rise. S&P 500 was up 1.43 for a 0.13% rise. Similarly tiny rises are seen on even broader markets like the Russell 2000 (down slightly) and the Wilshire 5000 (up slightly). It appears possible that Thursday's was another balance day. Even if we don't choose to discount the 3:30 p.m. rise on the Dow that brought all the upside for the day, the Dow's rise was only 0.24%. So not a staggering win. Similarly tiny incremental changes were in place on Friday. You can find these on your favourite web site. I like finance.yahoo.com and google.com/finance for various charts and stories. Of course, while the markets on Wall Street were expressing uncertainty, gold and silver surged higher. Gold set a new all-time high price per ounce at $1261.50 for intra-day trading on Friday. Depending on what you believe about inflation since 1980, the price of gold which reached $895 per ounce for the intra-day high in January 1980 on the April delivery contract represents a 2010 dollar price of around $3,000 per ounce, more or less. So, we aren't to the inflation-adjusted high, yet. The markets appear to be waiting for some signal or direction. By making that statement I am not anthropomorphizing the markets. I am commenting on the psychology of market players who do not seem to be ready for a major move, up or down. I think the fundamental reasons to expect a major move down on further bad news from BP, from governments, from sovereign debt problems, from currency problems, from public unrest over tyranny and brutality, all remain the sources of signals to look at. And most of the time these signals are going to be negative. Frustrated? Use this opportunity to shore up your own situation. And get ready for the ride to continue to be very bumpy.
TLE AFFILIATE
|